Tesla Model 3  ·  Argonne SMART 2.0  ·  PySpark Analytics

0.173
Combined Cost
202.2 Wh/km
Energy @ 70 km/h
243.5 Wh/km
Best Bin Avg
441K rows
Telemetry Points
29%
Autopilot Advantage
441,771
Total Rows
20
Test Drives
143
CAN-Bus Signals
10 Hz
Sampling Rate
522
Valid Wh/km Samples
4
Pipeline Steps

pipeline --steps

> 4-stage PySpark data engineering pipeline — ETL → Analytics → Visualization → BI

INPUT
20 CSV files · 441K rows
143 CAN-bus signals · 10 Hz
ETL
Parse · Clean · Filter
Segment · Feature-engineer
STORAGE
Parquet (Snappy, 8 shards)
+ CSV aggregates
OUTPUT
Charts · Power BI
Optimal speed: 70 km/h
⚙️ STEP 01
01_pyspark_etl_pipeline.py
PySpark ETL Pipeline

Loads 441K rows of raw CAN-bus telemetry across 20 CSV files. Parses pipe-separated columns, filters driving state, segments trips, and engineers Wh/km, speed bins, and driving mode features using Spark window functions.

PySpark Spark SQL Parquet
processed_telemetry/ (8 Snappy-compressed Parquet shards)
📊 STEP 02
02_visualizations.py
Visualization Engine

Generates 6 dark-theme Matplotlib/Seaborn charts: energy vs speed curve, autopilot comparison panels, combined cost overlay, SOC analysis, traffic impact, and a full dashboard PNG.

Matplotlib Seaborn SciPy
6 PNG charts in visualizations/
📈 STEP 03
03_powerbi_preparation.py
Power BI Preparation

Transforms aggregated results into a star-schema for Power BI: 4 fact tables + 3 dimension tables. Generates DAX measures and a full POWERBI_INSTRUCTIONS.txt with relationship diagrams.

Pandas Power BI DAX
powerbi_data/ star-schema CSVs
🎯 STEP 04
04_optimal_speed_calculator.py
Optimal Speed Calculator

Computes the combined cost function C = 0.5×(energy_cost) + 0.5×(time_cost) across speed bins. Includes a Spark 4.0 CTE fix and a pure Pandas fallback for environments without Spark.

PySpark Pandas NumPy
optimal_speed.csv — 70 km/h identified as optimal

Results & Analysis

Key findings from 522 validated Wh/km samples across 11 test drives

Energy Efficiency by Speed Wh/km · lower is better
Other bins Optimal zone (60–80 km/h)
Driving Mode Efficiency Avg Wh/km by mode
276.6
Autopilot
Wh/km
Autopilot ACC Only Manual
Combined Cost Function C = 0.5 × (Energy Cost) + 0.5 × (Time Cost)  ·  minimum at 70 km/h
Energy Cost Time Cost Combined Cost Optimal (70 km/h)
70
km/h
Optimal Speed
🔋
202.2
Wh/km
At Optimal Speed
🤖
29%
better
Autopilot vs ACC
📉
0.173
score
Min Combined Cost
Optimal Speed — Full Breakdown
Speed Wh/km Energy Cost Time Cost Combined
70 km/h 202.20.2020.143 0.173 ✓
80 km/h295.50.2960.1250.210
60 km/h369.10.3690.1670.268
50 km/h360.80.3610.2000.280
40 km/h356.00.3560.2500.303

visualizations --charts

> 6 dark-theme charts generated by the pipeline — hover to enlarge

01 · Energy vs Speed (U-Curve)
Energy efficiency vs speed — shows U-curve with optimal zone at 60-80 km/h

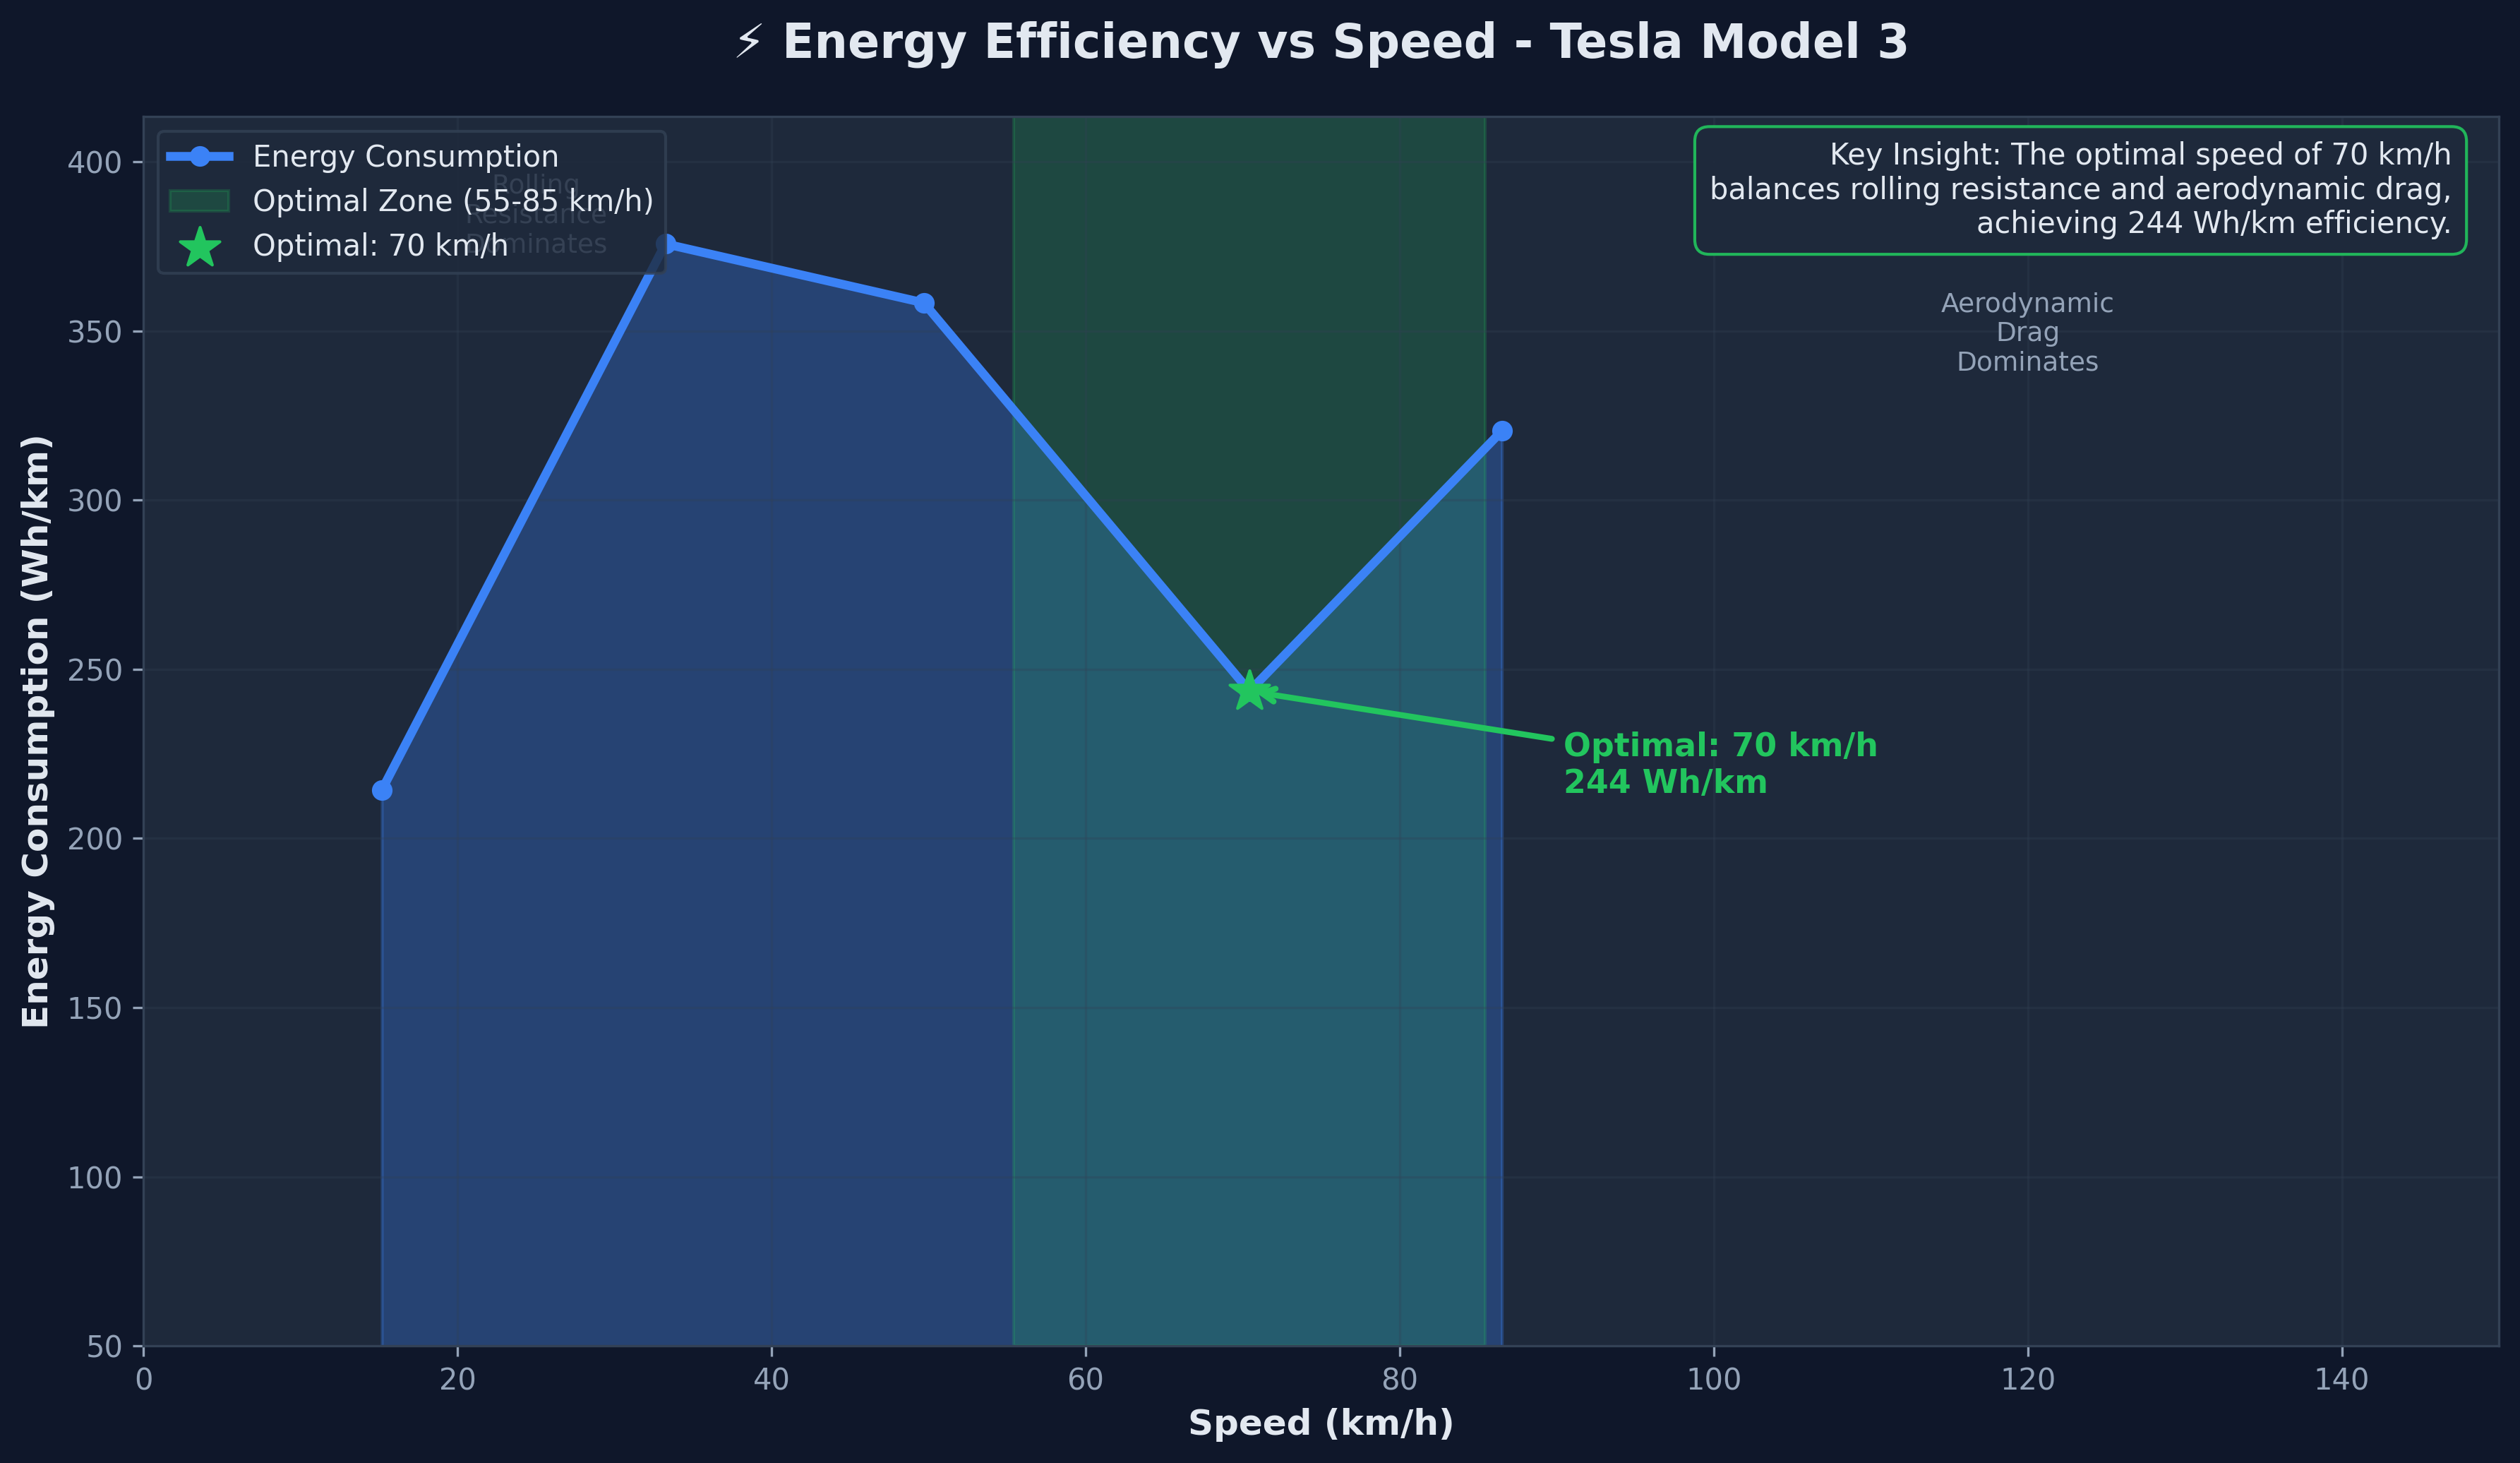
Wh/km vs speed curve. Optimal zone (±15 km/h) marked. Physics annotations explain rolling resistance at low speed and aerodynamic drag at high speed.

02 · Autopilot vs Manual vs ACC Comparison
4-panel comparison of energy, speed, jerk and variability across driving modes

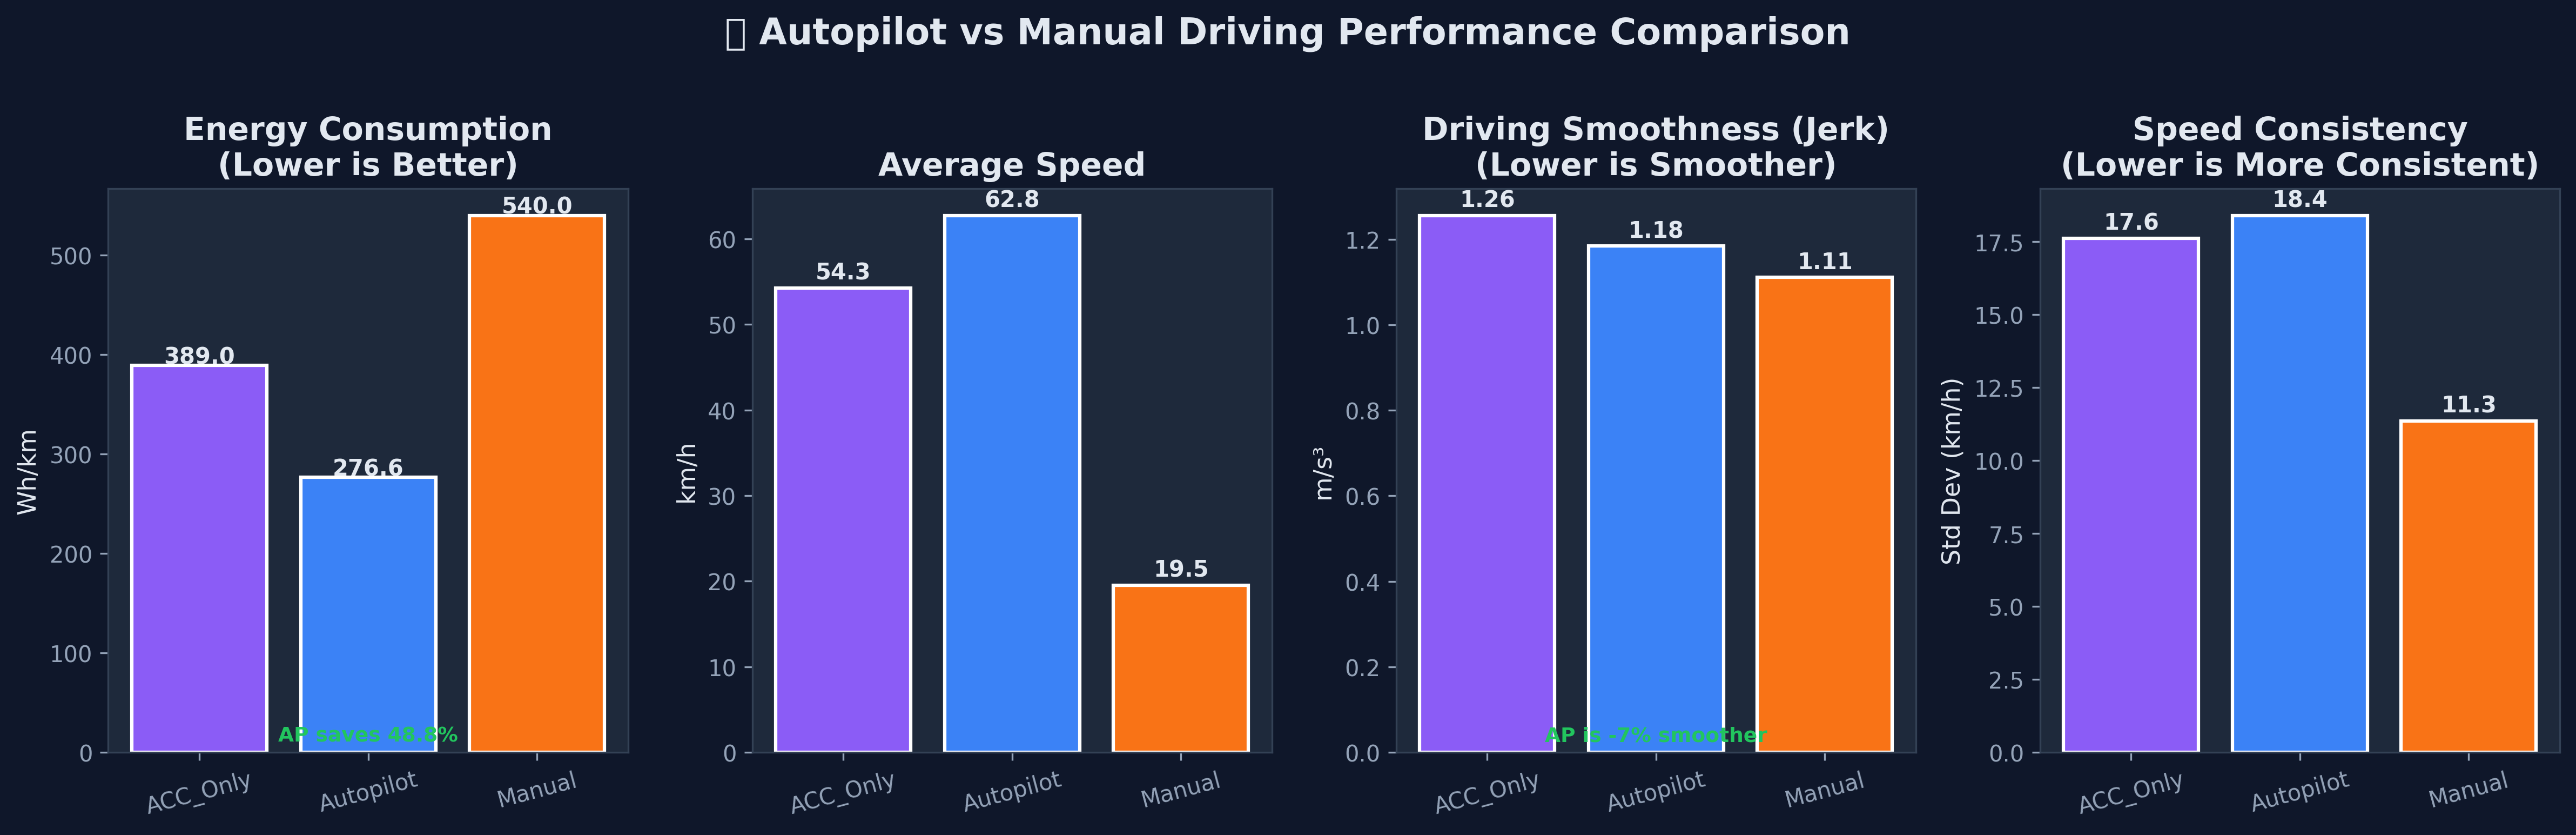
4-panel grouped bar chart: energy consumption, average speed, jerk, and speed variability for Autopilot / ACC-Only / Manual modes.

03 · Combined Cost Overlay
Normalized energy cost, time cost and combined cost vs speed with global minimum marked

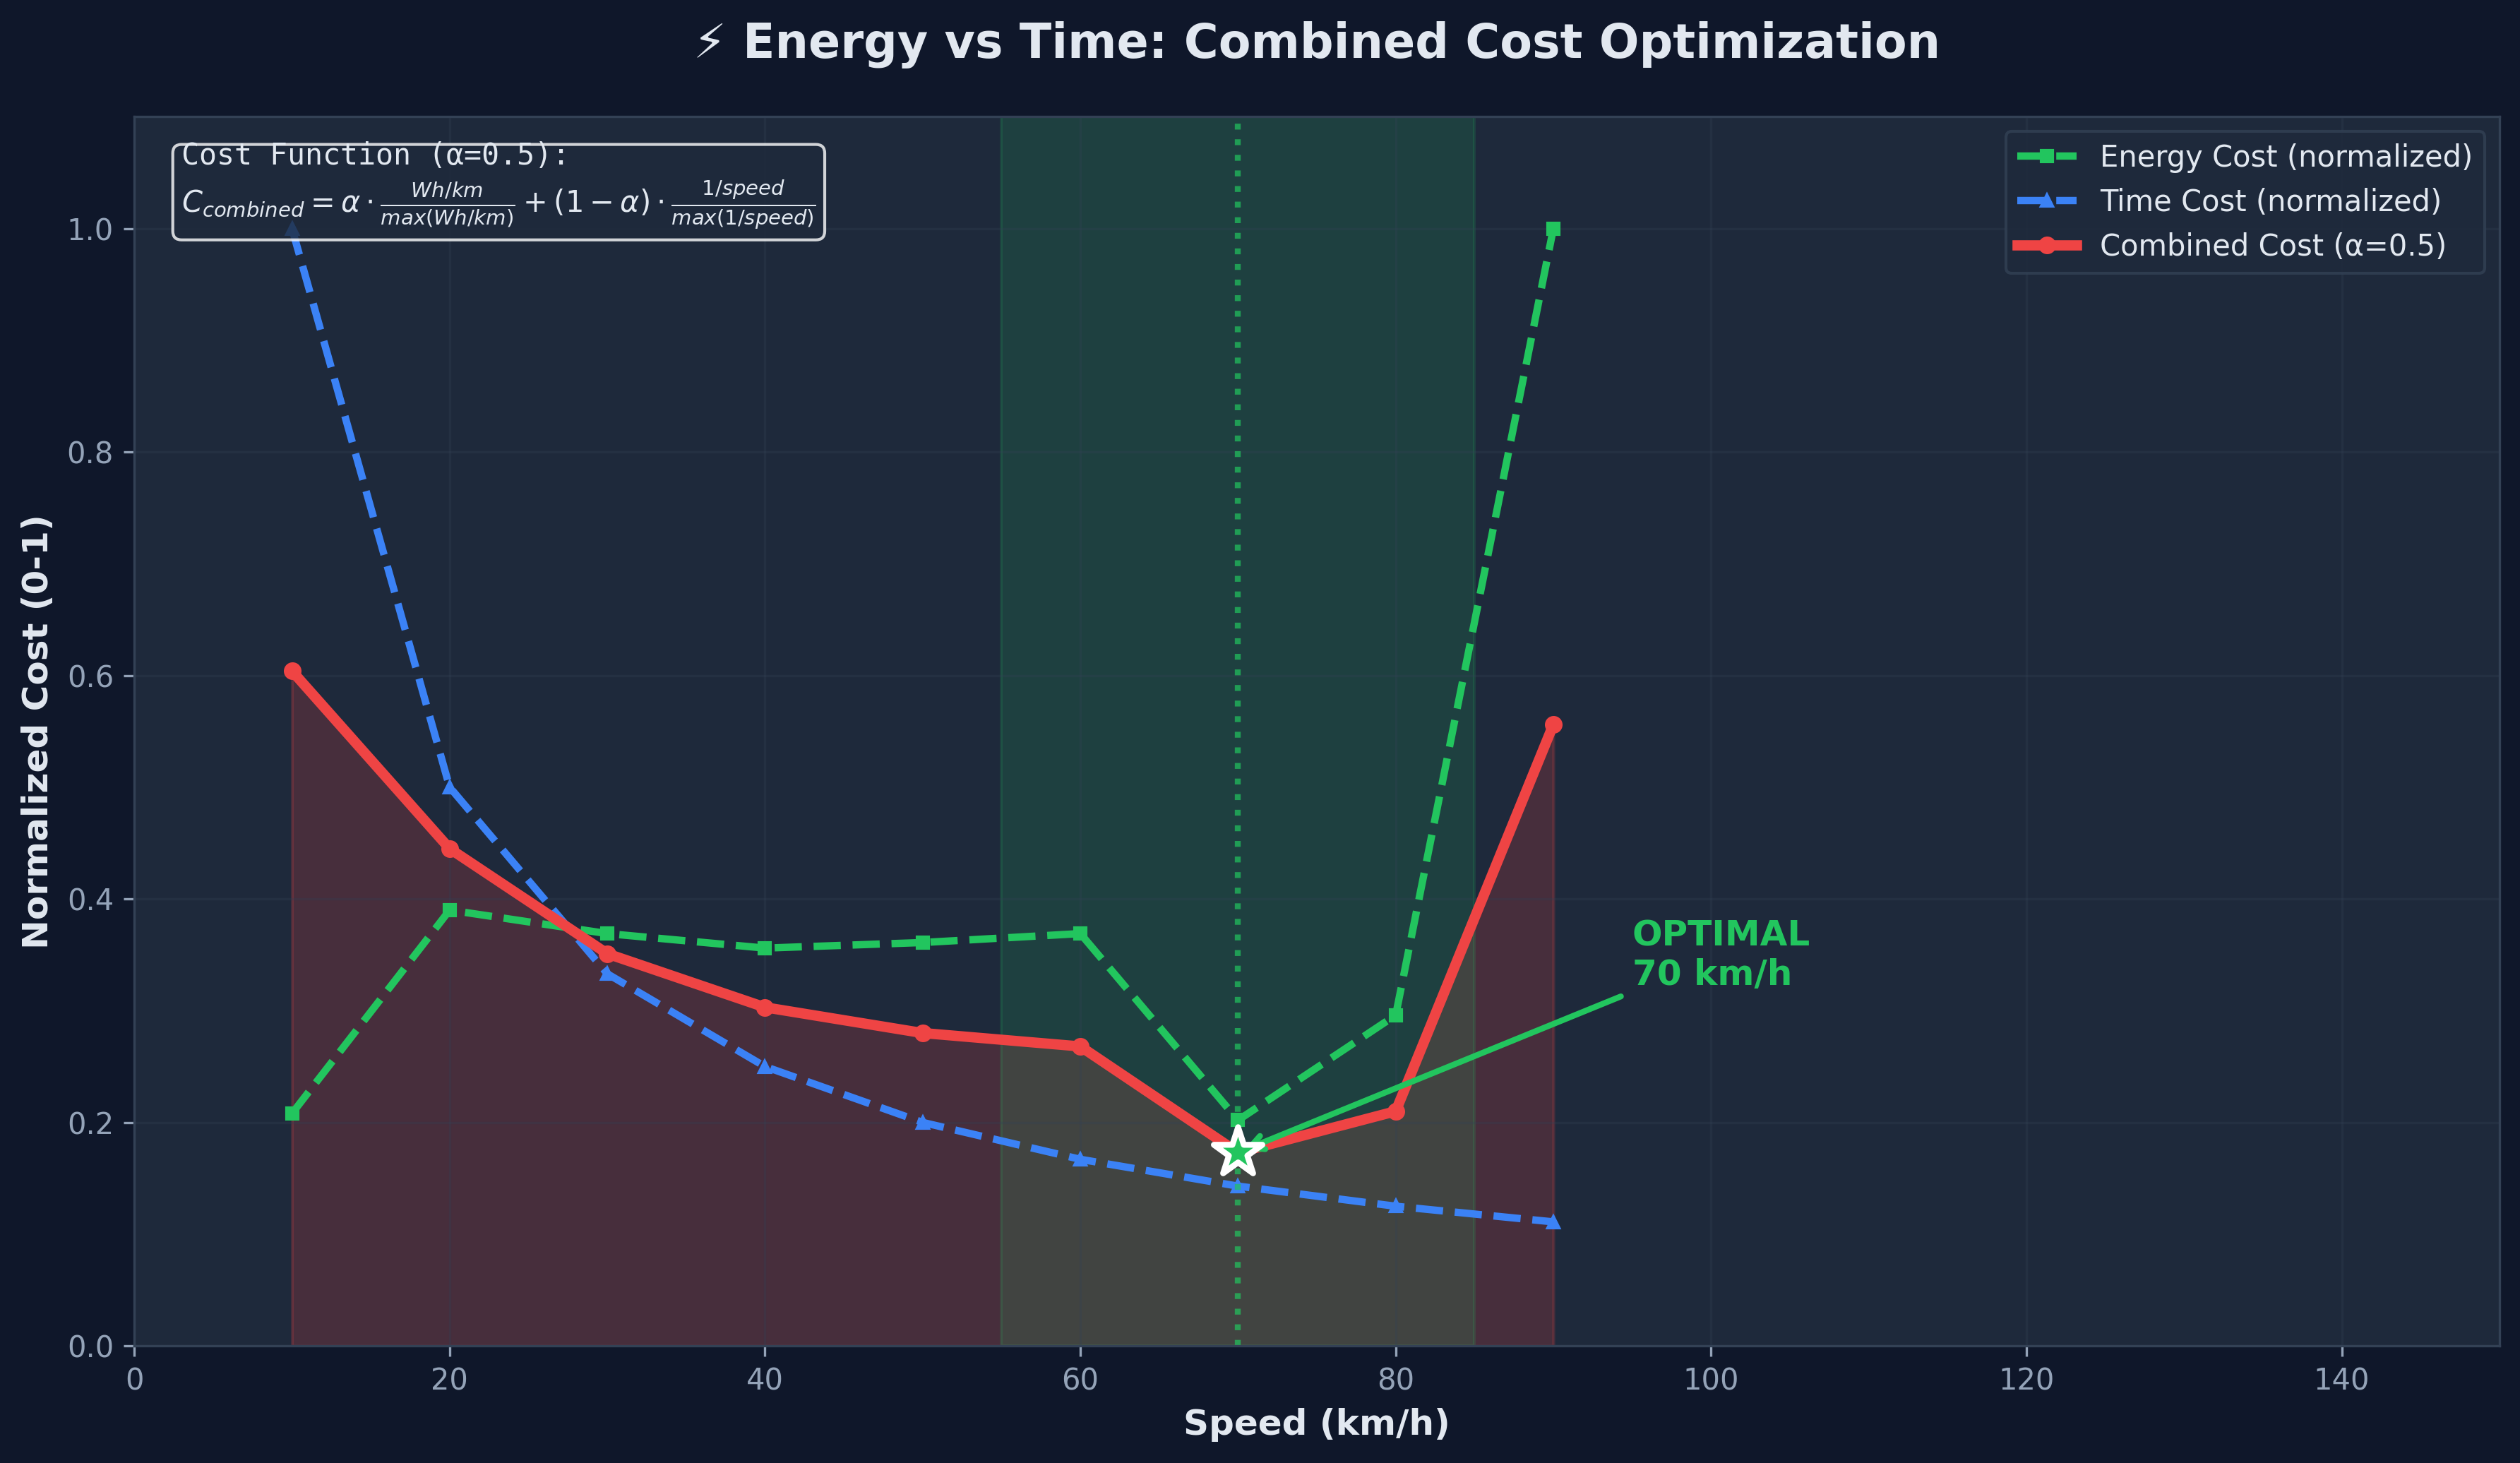
Normalized energy + time cost overlay. Global minimum at 70 km/h clearly visible.

04 · State of Charge Analysis
SOC percentage vs distance with linear regression and range estimate

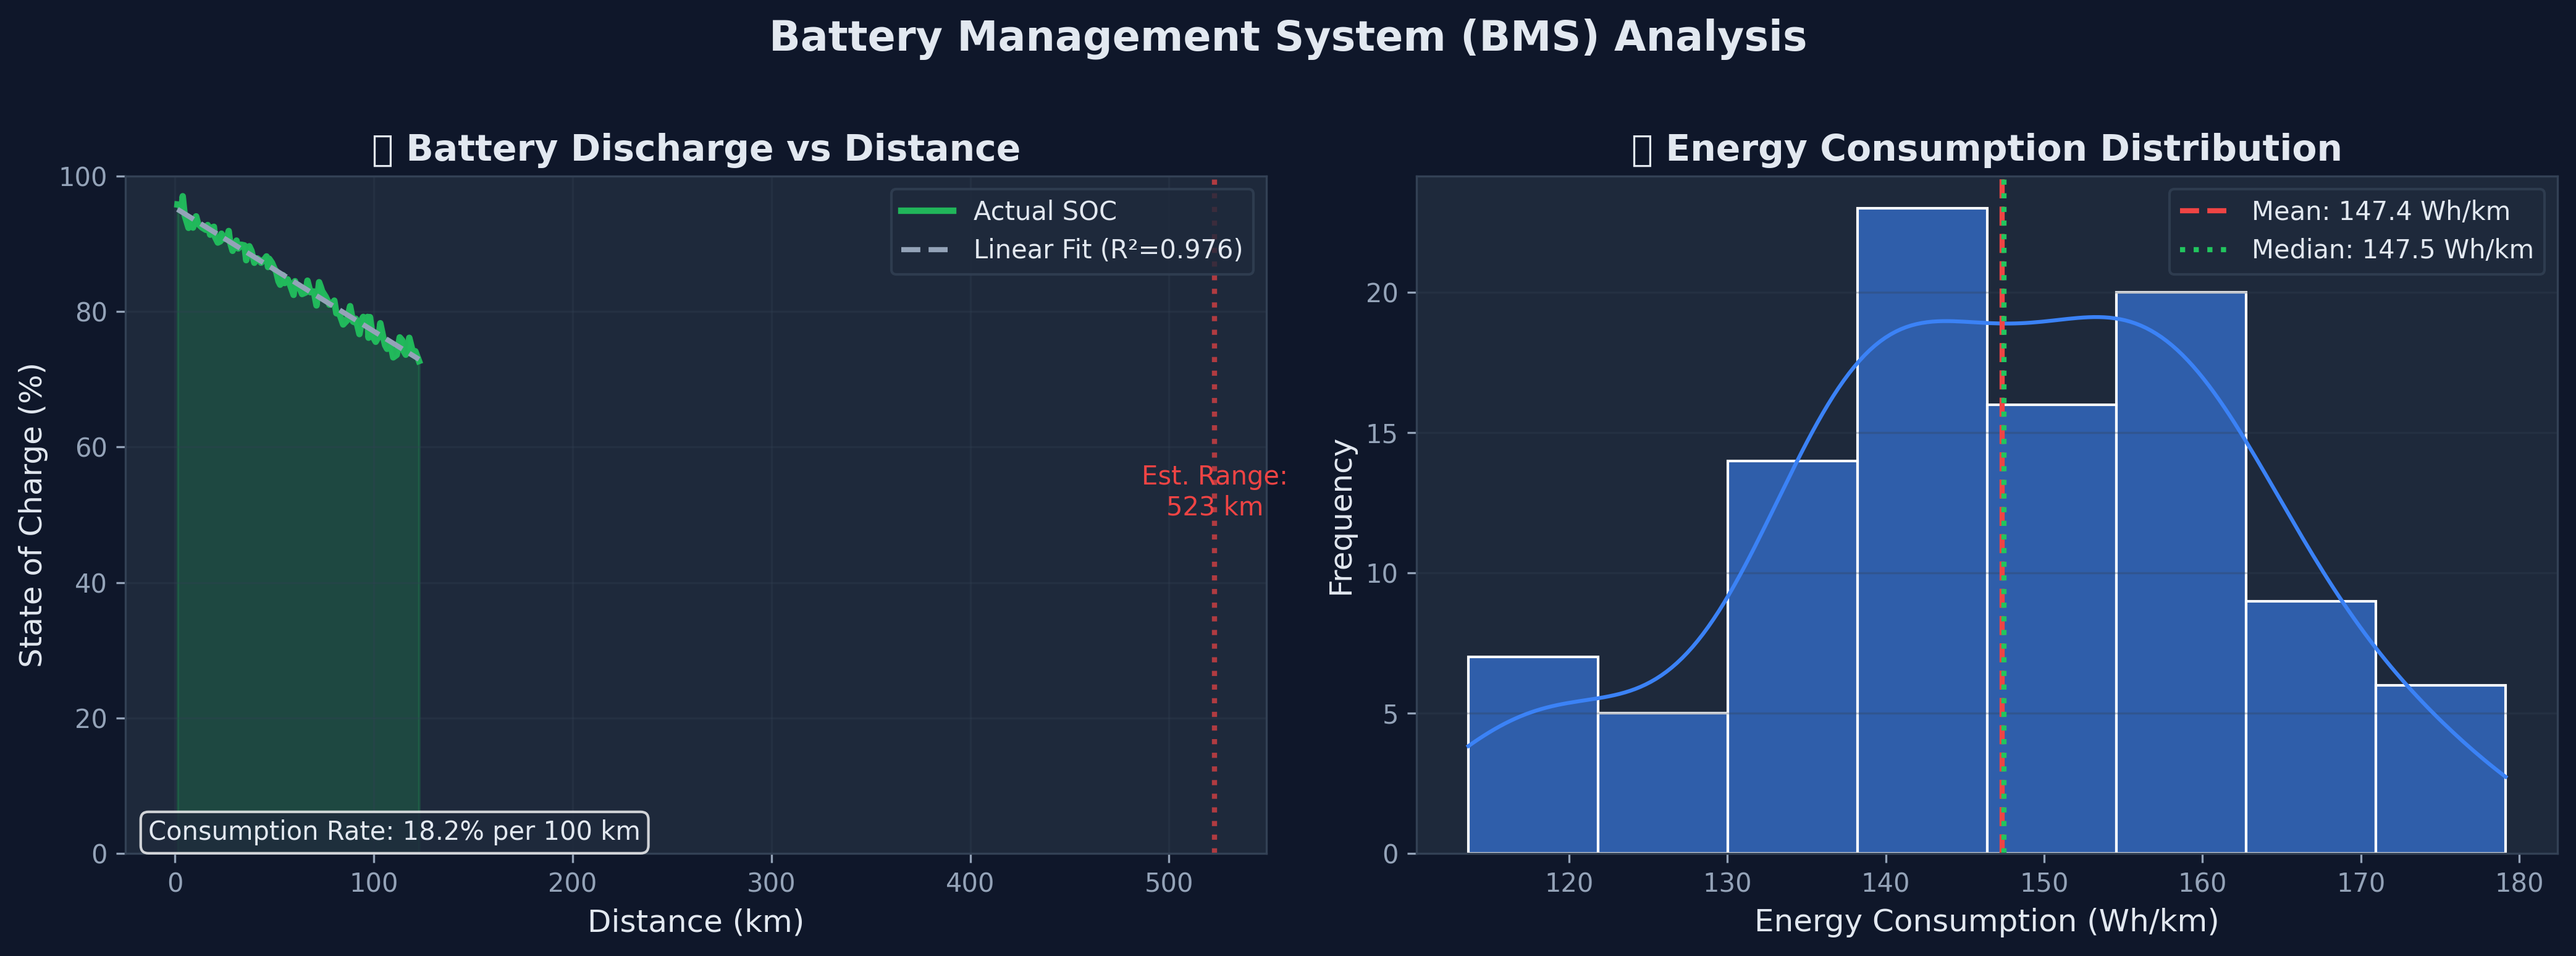
SOC% vs distance + linear regression for range estimation. Energy consumption histogram with mean/median lines.

05 · Traffic Impact
Energy efficiency and speed by traffic density

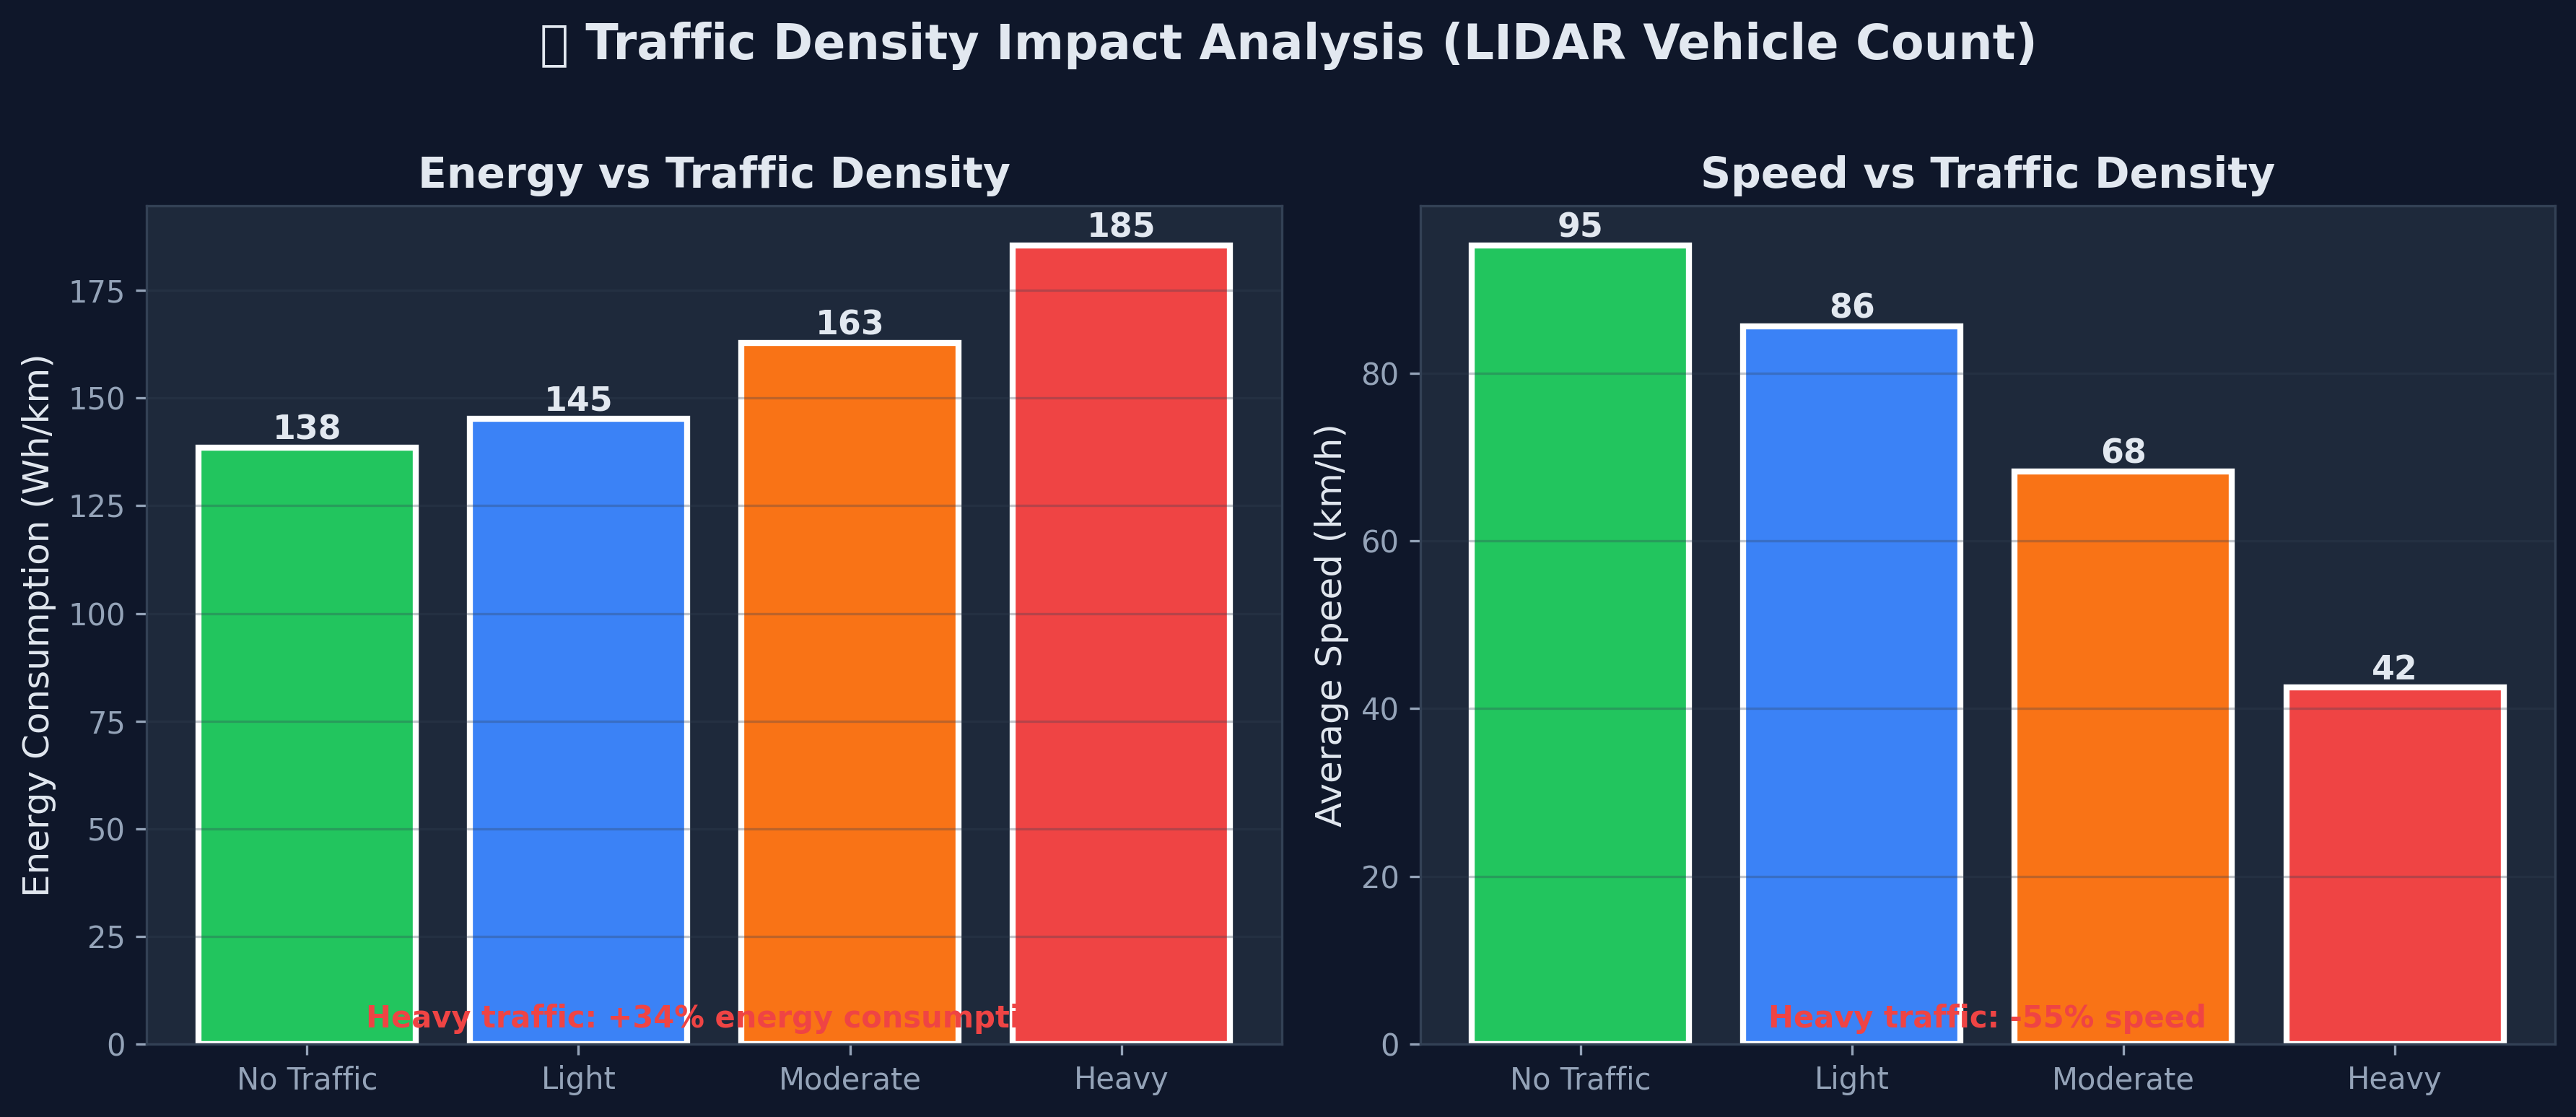
Wh/km and avg speed by traffic density: No Traffic → Light → Moderate → Heavy.

06 · Full Dashboard
5-panel summary dashboard: optimal speed, autopilot comparison, traffic, jerk, SOC KPI

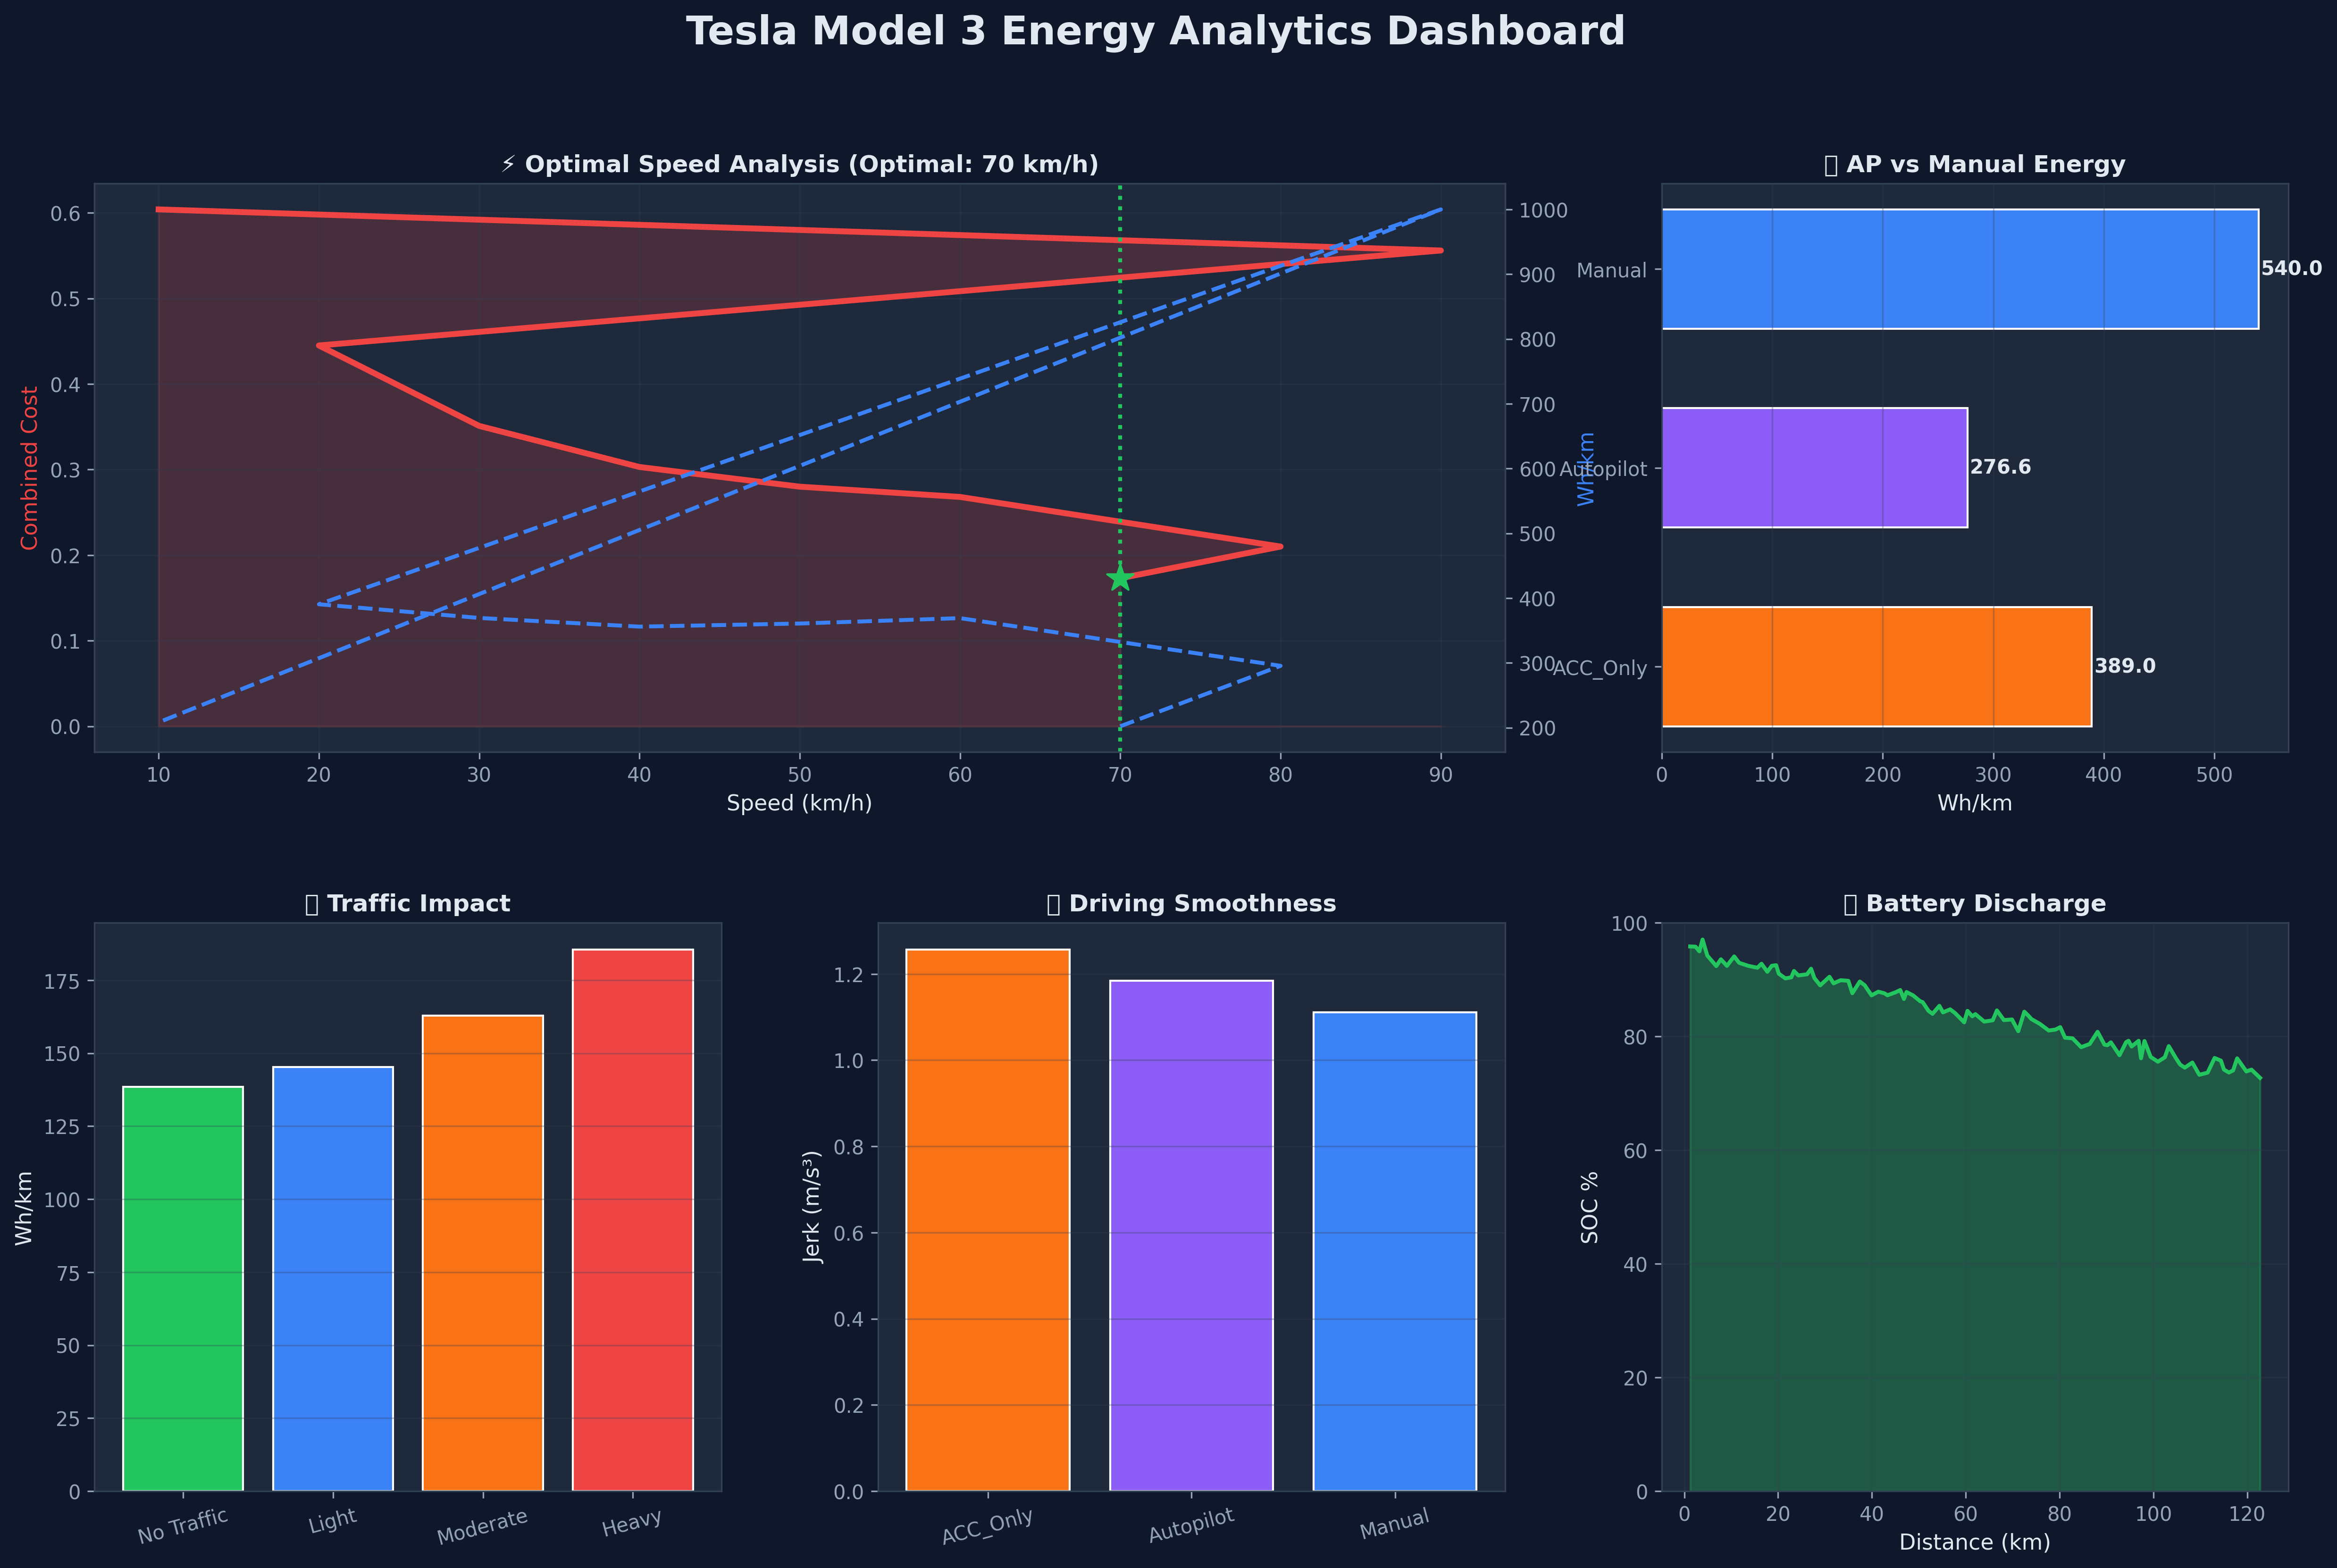
Complete 5-panel summary dashboard combining all key findings in a single view.

tech --stack

> Production-grade data engineering tools from ingestion to insight

# distributed-compute
PySpark 4.0.1
Window functions · Spark SQL · Parquet I/O
🗃️
Apache Parquet
Snappy compression · 8 partition shards
# data-processing
🐼
Pandas
Fallback optimizer · Power BI prep · star-schema
🔢
NumPy · SciPy
Normalization · linear regression · range estimates
# visualization
📊
Matplotlib · Seaborn
6 dark-theme charts · physics annotations · dashboards
📈
Power BI
Star-schema · 4 fact + 3 dim tables · DAX measures
# data-source
🚗
Argonne SMART2.0
2020 Tesla Model 3 · 20 test drives · 441K rows · 10 Hz CAN-bus
🔌
CAN-Bus Signals
143 columns: BMS, DAS, GPS, LIDAR, Radar, Autopilot state

github --stats

> repository
Stars Forks Last Commit Size
> built-with
Python PySpark Pandas Power BI Parquet
> contributor-activity
GitHub Stats